 |  |

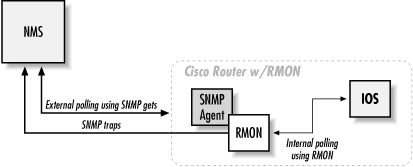
SNMP can perform either internal or external polling. Internal polling is typically used in conjunction with an application that runs as a daemon or a facility such as cron that periodically runs a local application. External polling is done by the NMS. The OpenView NMS provides a great implementation of external polling; it can graph and save your data for later retrieval or notify you if it looks like something has gone wrong. Many software packages make good NMSs, and if you're clever about scripting you can throw together an NMS that's fine-tuned to your needs. In this chapter, we will look at a few of the available packages.
Polling is like checking the oil in a car; this analogy may help you to think about appropriate polling strategies. Three distinct items concern us when checking the oil: the physical process (opening the hood, pulling out the dipstick, and putting it back in); the preset gauge that tells us if we have a problem (is the level too high, too low, or just right?); and the frequency with which we check it (once an hour, week, month, or year?).
Let's assume that you ask your mechanic to go to the car and check the oil level. This is like an NMS sending a packet to a router to perform an snmpget on some piece of information. When the mechanic is finished, you pay him $30 and go on your way. Because a low oil level may result in real engine damage, you want to check the oil regularly. So how long should you wait until you send the mechanic out to the car again? Checking the oil has a cost: in this scenario, you paid $30. In networks, you pay with bandwidth. Like money, you have only so much bandwidth, and you can't spend it frivolously. So the real question is, how long can you wait before checking the oil again without killing your budget?
The answer lies within the car itself. A finely tuned racing car needs to have its fluids at perfect levels. A VW Beetle,[36] unlike a racecar, can have plus or minus a quart at any time without seriously hindering its performance. You're probably not driving a Beetle, but you're probably not driving a racecar either. So you decide that you can check the oil level about every three weeks. But how will you know what is low, high, or just right?
[36]The old ones from the 1960s, not the fancy modern ones.The car's dipstick tells you. Your mechanic doesn't need to know the car model, engine type, or even the amount of oil in the car; he only needs to know what value he gets when he reads the dipstick. On a network, a device's dipstick is called an agent, and the dipstick reading is the SNMP response packet. All SNMP-compatible devices contain standardized agents (dipsticks) that can be read by any mechanic (NMS). It is important to keep in mind that the data gathered is only as good as the agent, or mechanic, that generated it.
In both cases, some predefined threshold determines the appropriate action. In the oil example, the threshold is "low oil," which triggers an automatic response: add oil. (Crossing the "high oil" threshold might trigger a different kind of response.) If we're talking about a router interface, the possible values we might receive are "up" and "down." Imagine that your company's gateway to the Internet, a port on a router, must stay up 24 hours a day, 7 days a week. If that port goes down, you could lose $10,000 for each second it stays down. Would you check that port often? Most organizations won't pay someone to check router interfaces every hour, let alone every second. Even if you had the time, that wouldn't be fun, right? This is where SNMP polling comes in. It allows network managers to guarantee that mission-critical devices are up and functioning properly, without having to pay someone to constantly monitor routers, servers, etc.
Once you determine your monitoring needs, you can specify at what interval you would like to poll a device or set of devices. This is typically referred to as the poll interval, and can be as granular as you like (e.g., every second, every hour, etc.). The threshold value at which you take action doesn't need to be binary: you might decide that something's obviously wrong if the number of packets leaving your Internet connection falls below a certain level.
TIP: Whenever you are figuring out how often to poll a device, remember to keep three things in mind: the device's agent/CPU, bandwidth consumption, and the types of values you are requesting. Some values you receive may be 10-minute averages. If this is the case, it is a waste to poll every few seconds. Review the MIBs surrounding the data for which you are polling. My preference is to start polling fairly often. Once I see the trends and peak values, I back off. This can add congestion to the network but ensures that I don't miss any important information.Whatever the frequency at which you poll, keep in mind other things that may be happening on the network. Be sure to stagger your polling times to avoid other events if possible. Keep in mind backups, data loads, routing updates, and other events that can cause stress on your networks or CPUs.
This is where internal polling comes in. As its name implies, internal polling is performed by an agent that is internal, or built in, to the device you want to manage. Since polling is internal to the device, it doesn't require traffic between the agent and your NMS. Furthermore, the agent doing the polling does not have to be an actual SNMP agent, which can allow you to monitor systems (either machines or software) that do not support SNMP. For example, some industrial-strength air-conditioning-equipment vendors provide operational status information via a serial port. If the air-conditioning unit is attached to a terminal server or similar device, it becomes easy to use scripting languages to monitor the unit and generate traps if the temperature exceeds a certain threshold. This internal program can be written in your favorite scripting language, and it can check any status information to which you can get access. All you need is a way to get data from the script to the management station.
One strategy for writing a polling program is to use "hooks" within a program to extract information that can then be fed into an SNMP trap and sent to the NMS. We will cover traps more in Chapter 10, "Traps". Another way to do internal polling is to use a program (e.g., sh, Perl, or C) that is run at set intervals. (On Unix, you would use cron to run a program at fixed intervals; there are similar services on other operating systems.) Hooks and cron-driven scripts both allow you to check internal variables and report errors as they are found. Here is a Perl script that checks for the existence of a file and sends a trap if the file is not found:
#!/usr/local/bin/perl
# Filename: /opt/local/perl_scripts/check4file.pl

use SNMP_util "0.54";  # This will load the BER and SNMP_Session modules for us

$FILENAME = "/etc/passwd";

#
# if the /etc/passwd file does not exist, send a trap!
#
if(!(-e $FILENAME)) {
    snmptrap("public\@nms:162", ".1.3.6.1.4.1.2789", "sunserver1", 6, 1547, \
             ".1.3.6.1.4.1.2789.1547.1", "string", "File \:$FILENAME\: Could\
             NOT Be Found");
}
Notice that we poll four minutes after each quarter hour, rather than on the quarter hour. The next poll we insert into the crontab file may run five minutes after the quarter hour (5,20,35,50). This practice prevents us from starting a huge number of programs at the same time. It's a particularly good idea to avoid polling on the hour -- that's a popular time for random programs and cron jobs to start up. Consult the cron manpage if you are unfamiliar with its operation.$ crontab -l # Check for this file every 15 minutes and report trap if not found 4,19,34,49 * * * * /opt/local/perl_scripts/check4file.pl
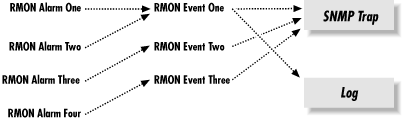
Many devices support RMON, making it an effective mechanism for internal polling. For example, Cisco supports the Events and Alarms RMON categories. You can configure the Alarms category to poll MIBs internally and react in different ways when a rising or falling threshold occurs. Each threshold has the option of calling an internal Event. Figure 9-1 shows the flow that these two RMON categories take.
In addition to sending traps, we can also log events; if we so choose, we can even log the event without generating a trap. Logging can be particularly useful when you are initially configuring RMON alarms and events. If you make your alarm conditions too sensitive, you can clog your NMS with trigger-happy RMON events. Logging can help you fine-tune your RMON alarms before they are released into production.
If you're familiar with IOS, you should be expecting a corresponding no command that discards an RMON event:rmon event number [log] [trap community] [description string] [owner string]
The parameters to these IOS commands are:no rmon event number
You can also use logging to keep track of when the events were called. Though you can configure traps without logging, what happens if the line to your NMS goes down? Logging ensures that you don't lose information when the NMS is disabled. We suggest using both log and trap on all your events. You can view the logs of your RMON events by issuing the following command on the router:(config)#rmon event 1 log trap public description "High ifInOctets" owner dmauro (config)#rmon event 2 log description "Low ifInOctets" owner dmauro
orarouter1# show rmon event

Event 1 is active, owned by dmauro
 Description is High ifInOctets
 Event firing causes log and trap to community public, last fired 00:05:04
 Current log entries:
      index       time   description
          1   00:00:31   High ifInOctets
          2   00:05:04   High ifInOctets
Event 2 is active, owned by dmauro
 Description is Low ifInOctets
 Event firing causes log, last fired 00:00:11
 Current log entries:
      index       time   description
          1   00:00:11   Low ifInOctets
$ snmpwalk orarouter1 .iso.org.dod.internet.mgmt.mib-2.rmon.event.eventTable
rmon.event.eventTable.eventEntry.eventIndex.1 : INTEGER: 1
rmon.event.eventTable.eventEntry.eventIndex.2 : INTEGER: 2
rmon.event.eventTable.eventEntry.eventDescription.1
                           : DISPLAY STRING- (ascii): High ifInOctets
rmon.event.eventTable.eventEntry.eventDescription.2
                           : DISPLAY STRING- (ascii): Low ifInOctets
rmon.event.eventTable.eventEntry.eventType.1 : INTEGER: log-and-trap
rmon.event.eventTable.eventEntry.eventType.2 : INTEGER: log
rmon.event.eventTable.eventEntry.eventCommunity.1 : OCTET STRING- (ascii): public
rmon.event.eventTable.eventEntry.eventCommunity.2 : OCTET STRING- (ascii):
rmon.event.eventTable.eventEntry.eventLastTimeSent.1 : Timeticks: (0) 0:00:00.00
rmon.event.eventTable.eventEntry.eventLastTimeSent.2 : Timeticks: (0) 0:00:00.00
rmon.event.eventTable.eventEntry.eventOwner.1 : DISPLAY STRING- (ascii):  dmauro
rmon.event.eventTable.eventEntry.eventOwner.2 : DISPLAY STRING- (ascii):  dmauro
rmon.event.eventTable.eventEntry.eventStatus.1 : INTEGER: valid
rmon.event.eventTable.eventEntry.eventStatus.2 : INTEGER: validTIP: You can poll the objects ifDescr and ifType in the mgmt.interfaces.ifEntry subtree to help you identify which instance number you should use for your devices. If you are using a device with multiple ports, you may need to search the ifType, ifAdminStatus, and ifOperStatus to help you identify what's what. In Section 9.2, "External Polling", we will see that it is not necessary to keep track of these MIB variables (the external polling software takes care of this for us).Now that we have our events configured, let's start configuring alarms to do some internal polling. We need to know what we are going to poll, what type of data is returned, and how often we should poll. Assume that the router is our default gateway to the Internet. We want to poll the router's second interface, which is a serial interface. Therefore, we want to poll mgmt.interfaces.ifEntry.ifInOctets.2 to get the number of outbound octets on that interface, which is an INTEGER type.[37] To be precise, the ifInOctets MIB object is defined as "The total number of octets received on the interface, including framing characters." (The .2 at the end of the OID indicates the second entry in the ifEntry table. On our router, this denotes the second interface, which is the one we want to poll.) We want to be notified if the traffic on this interface exceeds 90,000 octets/second; we'll assume things are back to normal when the traffic falls back under 85,000 octets/second. This gives us the rising and falling thresholds for our alarm. Next, we need to figure out the interval at which we are going to poll this object. Let's start by polling every 60 seconds.
[37]From RFC 1757, the alarmVariable (the object/MIB we are going to poll) needs to resolve to an ASN.1 primitive type of INTEGER, Counter, Gauge, or TimeTicks.Now we need to put all this information into a Cisco RMON alarm command. Here is the command to create an alarm:
rmon alarm number variable interval {delta | absolute}
    rising-threshold value [event-number]
    falling-threshold value [event-number]
    [owner string]
The parameters to these commands are:no rmon alarm number
This command configures alarm number 25, which monitors the object in ifEntry.10.2 (instance 2 of ifEntry.ifInOctets, or the input octets on interface 2) every 60 seconds. It has a rising threshold of 90,000 octets, which has event number 1 tied to it: event 1 is called when traffic on this interface exceeds 90,000 octets/second. The falling threshold is set to 85,000 octets and has event number 2 tied to it. Here's how the alarm looks in the router's internal tables:orarouter1(config)#rmon alarm 25 ifEntry.10.2 60 absolute \ rising-threshold 90000 1 falling-threshold 85000 2 owner dmauro
The last line of output says that the router will enable the alarm upon reboot. As you'd expect, you can also look at the alarm settings through the RMON MIB, beginning with the subtree 1.3.6.1.2.1.16. As with the events themselves, we can create, change, edit, and delete entries using snmpset.orarouter1#show rmon alarm Alarm 1 is active, owned by dmauro Monitors ifEntry.10.2 every 60 second(s) Taking absolute samples, last value was 87051 Rising threshold is 90000, assigned to event 1 Falling threshold is 85000, assigned to event 2 On startup enable rising or falling alarm
One problem with internal polling is that getting trends and seeing the data in a graph or table is difficult. Even if you develop the backend systems to gather MIB objects and display them graphically, retrieving data is sometimes painful. The Multi Router Traffic Grapher (MRTG) is a great program that allows you to do both internal and external polling. Furthermore, it is designed to generate graphs of your data in HTML format. MRTG is covered in Chapter 13, "MRTG".
|  | |
| 8.4. Error Responses |  | 9.2. External Polling |

Copyright © 2002 O'Reilly & Associates. All rights reserved.